
What makes the sfdx CLI tick? Sometimes learning how something works can be as much fun as actually using it.
The goal here is to capture the raw API calls the sfdx CLI is sending to the Salesforce APIs. In addition to a better understanding of what it is doing you can use it to debug the CLI itself.
This post was inspired by a, ahem, very similar post by Christian Carter - SFDX With Charles Proxy. The primary difference is that I'm using Fiddler on Windows rather than Charles Proxy on macOS.
Using the direct sfdx logging support is another option to monitor what is going on. Or even browsing the source directly under %LOCALAPPDATA%\sfdx (seems they are going to some lengths to hide the source now). While something like fiddler is more complicated (some might even say "fiddly") to configure, it is harder to hide anything from it (intentionally or otherwise).
Configure to intercept HTTPS traffic
After installation the first this is to configure Fiddler and Windows to allow interception and decryption of HTTPS traffic.


- Tools > Options
- HTTPS tab
- Check Decrypt HTTPS traffic
- Click 'Yes' to reconfigure Windows' Trusted CA Certificate You might want to read up on what a Root Certificate is before doing so.
- (Optional) change the drop down from "... from all processes" to "... from non-browsers only"
- (Optional) Toggle the "Skip decryption for the following hosts" to "Perform decryption for the following hosts". Then add *.salesforce.com
Now the Fiddler is ready to intercept the traffic you need to configure sfdx to send it to the correct location. The default proxy port of 8888 is configured under Options > Connections > Fiddler listens on port:...
set http_proxy=http://localhost:8888
set https_proxy=https://localhost:8888
If you just stop there and try and call sfdx force:org:list you will find the CONNECTED STATUS comes back as "ECONNRESET". It would appear that node.js doesn't like our self signed root certificate. You can tell node to mind its own business with:
set NODE_TLS_REJECT_UNAUTHORIZED=0
Again, you only want to do this for a single session and not configure that across all processes. It potentially opens you up to all sorts of man in the middle security attacks.
Now what?
Now my friend, now we can see each and every callout to the Salesforce APIs and the corresponding responses.
Lets look at what happens with the command sfdx force:org:list.
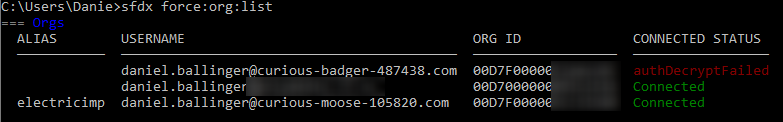
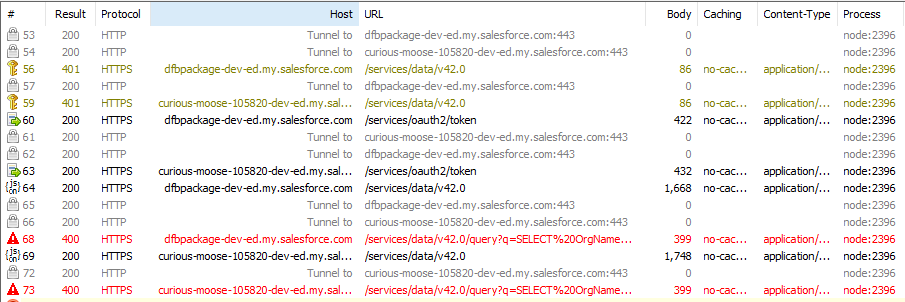
This reveals up to four API calls per valid Org. The exact calls will depend on the org types and if you have recently successfully authenticated to them. Generally, you get:
- A failed GET /services/data/v42.0 with an invalid token
- A POST /services/oauth2/token to refresh the access token
- A successful GET /services/data/v42.0
- A GET /services/data/v42.0/query?q=... with a SOQL query over ScratchOrgInfo. Presumably this only works with Scratch Orgs at this time.
So every org you register with SFDX needs 3 or 4 API calls with a force:org:list. There is certainly something to be said for dropping unused orgs.
Anyway... Happy Fiddling!