Wednesday, June 27, 2018

Speeding up Salesforce unit testing performance

For many years I've had this thorn in my side with Apex test cases. It goes by the name of "Disable Parallel Apex Testing" and since Spring `13 (v27.0) it has needed to be enabled constantly else I'd get a UNABLE_TO_LOCK_ROW error due to the custom hierarchy settings that get updated in the test cases.

Leap forward to Summer/Winter `18 (v42.0/v43.0) and I'm still tangling with this. That's five years of waiting for all the test classes to run sequentially one after another. That's about the right amount of procrastination to finally fix this problem! So hold on, were going to raise a support case and keep at this until the bitter end1.

What follows is a true story. The namespaces and class names have been changed to protect the innocent, but the snippets of messages with support are real.

Step 1 - Turning off "Disable Parallel Apex Testing"

This was simple enough. Uncheck a checkbox, run all the tests, and... Uh oh.

Could not run tests on class 01p400000000001 because: connection was cancelled here

With that setting checked all my tests were passing. Now some of my previously passing test classes are falling over when run in parallel. Worse still, the specific test classes to fail were intermittent. It wasn't just one specific class causing a problem. Any one of a dozen or so classes could fail in this manner and they would change from run to run.

Step 2 - Winter `18 @isTest isParallel annotation to the rescue

Winter 18 added the new @isTest(isParallel=true) annotation to:

indicate test classes that can run in parallel and aren’t restricted by the default limits on the number of concurrent tests.

That's great, except I don't want to modify 90% of my test classes to deal with the 10% that are having issues. No, I'll just use @isTest(isParallel=false) and explicitly exclude the problem cases... except that doesn't work. At least not at the time of writing. Please vote for the idea Parallel Tests Option (isParallel) on the @IsTest Annotation to exclude tests to make this a viable approach.

Step 3 - Once more unto the support case, dear friends, once more

[Day 1 - 2018-05-09] Desperate times. Let's raise a support case to see if they can isolate the underlying issue.

[Day 6 - 2018-05-14] After a bit of back and forth with tier 2 to establish how to reproduce the problem (press the run all test cases in the org) the initial advice back was:

The root cause of this issue?
Answer: - Parallel test execution is the root cause of this issue.

Solution?
Answer: - Disable Parallel test execution.

Question: - Why do you need to Disable Parallel Apex Testing?
Answer: - As per the salesforce document, Tests that are started from the Salesforce user interface (including the Developer Console) run in parallel. Parallel test execution can speed up test run time. Sometimes, parallel test execution results in data contention issues, and you can turn off parallel execution in those cases.

Huh. Well, yes I knew that already (as per the case description when I raised it). That would work, but it's been five years of this situation, so lets push a bit harder. SHIBBOLEET!

Step 4 - How bad is the problem empirically?

Before responding with a kiwi yeah-nah to support I timed the total test run time for both parallel and synchronous test execution:

As it stood, the parallel test execution was marginally faster as long as I reran any initially failed test cases immediately after the first run completed. That was an interesting result, and I think I can explain the similar timing between the two later on.

The general consensus on twitter was that updates to custom hierarchy settings were probably to blame for the contention and subsequent timeouts.

Step 5 - Isolating Custom Hierarchy Settings using the Stubbing API

I use a number of hierarchy custom settings to toggle various functions in the app. All interactions with those settings from Apex are done via a single class. This allows for sensible defaults etc...

Those with particular feelings on how mock testing should be performed or a sensitive testing disposition may want to look away now...

To prevent any potentially blocking DML operations on the custom hierarchy settings I've injected a StubProvider when in a testing context. The StubProvider prevents any DML occuring when altering the settings in Apex tests. This isn't the typical usage for a test mocking framework, but it serves my needs here to help avoid database locking issues.

Here is a shortened version of how it looks:

And after all that the result on the asynchronous test execution was..... not much really. The tests were marginally faster, but the underlying problem with the test classes having the connection closed remains. At least I can rule out DML on the custom settings as being the problem.

Step 6 - Back to the drawing board

Blaming the problem on the custom hierarchy settings made sense from a historical perspective, but it doesn't appear to be the source of my challenges.

I went back and had a closer look at the debug logs from the tests in the run. That's when I saw it:

"What?", you may ask, "Am I currently looking at?"

That colorful image is a selection of debug log timelines from various parallel test runs. Ignoring the majority of the markings, the important thing is a purple line representing a DML operation that is taking more and more of each transaction. Right up until the point that Salesforce starts terminating it. If we drill into one of those logs we can see it is a DML operation to insert 6 records taking 3 minutes 52 seconds (for 6 records!):

14:14:15.0 (325578801)|DML_BEGIN|[992]|Op:Insert|Type:DFB__OpportunityPriceType__c|Rows:6
14:18:07.376 (232376043557)|DML_END|[992]

Step 7 - Returning to the support case with proof

[Day 9 - 2018-05-17] If that isn't a smoking gun then I don't know what is. Let's take this new evidence back to the support case.

Me to support:

I've just noticed something else odd in the debug logs for the running tests. Inserts to DFB__OpportunityPriceType__c for 6 rows are taking an excessive amount of time.

I'm seeing times for the CommonTestSetup.createPriceTypeMappings() method of between 20 and 45 seconds to complete.
Attached Log1.txt - Look for the lines:
16:18:58.0 (150146460)|DML_BEGIN|[941]|Op:Insert|Type:DFB__OpportunityPriceType__c|Rows:6
16:19:19.214 (21214892238)|DML_END|[941]

It isn't clear to me why the inserts for those records are taking so long. The fields on it are [reasonably] basic and it is only 6 rows.
The only thing I can think of is that all the test classes are trying to use the same records and they all have the same indexed values in the PriceTypeID__c field.

A bit more context as you dear reader can't see into the org like support can.

I have a custom object DFB__OpportunityPriceType__c with a unique external id field. That field is indexed. Just about every single test class I have requires data in this custom object as it contains configuration that gets linked to from Opportunity records. I thought I was being clever and used a @TestSetup method to insert 6 of these records once for all the other test methods to use. There are no triggers, workflow outbound messages or other automatons hanging off this custom object. None of the test classes use SeeAllData=true.

Step 8 - More steps in the Support dance

[Day 13 - 2018-05-21] Support responds:

I reviewed your case and ran the test classes to troubleshoot the issue further. I noticed the error in the server log "RunningForTooLongException: connection was canceled here".
The error is thrown because - for asynchronous Apex tests, any test method execution has a timeout limit. Once an Apex test run exceeds 6 minutes, an internal process "kills" it.

After reviewing the logs, it seems that this particular method is taking time to execute when all the tests classes are run asynchronously - CommonTestSetup.minimalSetupWithSettings();

Can you please try to refactor this method and see if it can be optimized?
I see there are many methods being called from this function.

Another frustrating response. They pointed out the method that gets called directly in the @testSetup method. I'd already identified the inner method from that one and even the line in question. That it is a RunningForTooLongException is new information, but I'm no closer to what is blocking those records from inserting.

[Day 15 - 2018-05-23] We try a GoToMeeting. I work through with Tier 2 support in ensuring the external ID's that get assigned to DFB__OpportunityPriceType__c records in the test cases are unique per @testSetup. It didn't seem to help. Beyond that, I think support has a good grasp of the problem now.

[Day 20 - 2018-05-28] The support case has been escalated to Tier 3.

[Day 30 - 2018-06-07] Tier 3 responds:

- When 'Disable Parallel Apex Testing' checkbox is checked in Developer Console.
Result: Running Perfect

- When 'Disable Parallel Apex Testing' checkbox is unchecked in Developer Console.
Result: Exception is thrown

- In Serial Mode, it's working perfectly because it's running in Sync mode and no data contention issue.
However, in Parallel mode, multiple classes and trigger have been invoked in the same context/transaction where performing DML Operation and also making callouts and waiting for a response in Async mode. This may cause some data contention. Also since there is a lot of custom code involved it becomes very difficult for us to analyze the scenario.

- This is WAD as per Salesforce documentation. If Apex Class will take more than 6 minutes of time to complete the transaction, the connection will be closed by Salesforce DB.

- Test classes are run in serial mode during deployment. This error will not occur when you are trying to deploy your package.

Possible workarounds -

- Try to modify the code and remove that many dependencies.
- Else run in Serial Mode as a Workaround.

This seems distinctly like they put it in the too hard basket and are trying to avoid investigating the actual issue. I'll push back to see if I can get a better answer.

Also, I'm not sure what they mean by "making callouts and waiting for a response in Async mode". This is all happening in a test context. There are no callouts or waiting for async responses. I'm not going to pursue that as I don't want to get distracted.

[Day 35 - 2018-06-12] Update from support.

My T3 has officially logged an investigation with our RnD team on this issue. My RnD team is currently reviewing the case.

[Day 36 - 2018-06-13] An update from R&D, as communicated via Tier 2.

I have received an update from the DB team on this case.

As per the DB team, it seems that the parallel sessions are working on common recordsets and causing the wait events.
Because of this waitime the DB team is high and eventually the classes are getting timed out.

May be this explains why the insertion to DFB__OpportunityPriceType__c is taking time. We cannot exactly comment on the common recordsets but DFB__OpportunityPriceType__c records is one of the potential candidate.

Solution -
Have the parallel sessions work on different recordset/dependencies to avoid this situation.

So it appears that all the test cases are trying to work with the same record sets and they are all blocking until they can get exclusive access to those records. They either stack up and run one after another or wait so long they time out. This explains why the parallel test performance is so similar to the serial performance.

I'm fairly certain the DFB__OpportunityPriceType__c records are unique between @testSteup executions, so it must be something else...

Step 9 - Time to regroup

[Day 42 - 2018-06-19] Much to my shame I've closed the case out. I need time to regroup and revisit this from a new approach. I'm certainly not giving up on it yet and have a few ideas to try:

  • Try adjusting the Logging levels used when capturing the logs. Particularly around the Database logging levels. Also try capturing no logs at all.
  • Push the entire packages metadata into a Scratch Org and and retry the tests. The dev org doesn't have much data loaded, but the scratch org can provide a completely empty environment to ensure it isn't a data siloing issue.
  • If it is reproducable in the scratch org, start hacking parts out until it becomes easier to reproduce.
  • Remove the creation of the DFB__OpportunityPriceType__c records from the @testSetup. Only create them when required in the individual test methods.
  • Simplify the test cases where possible. The challenge is almost all of them work with Opportunities and OpportunityLineItems at some level. Which means a large overhead to construct all the dependent records as well.

Footnotes

  1. The bitter end may or may not occur within the timeframe of this blog post.

Wednesday, May 16, 2018

Fiddling with the SFDX CLI API calls

What makes the sfdx CLI tick? Sometimes learning how something works can be as much fun as actually using it.

The goal here is to capture the raw API calls the sfdx CLI is sending to the Salesforce APIs. In addition to a better understanding of what it is doing you can use it to debug the CLI itself.

This post was inspired by a, ahem, very similar post by Christian Carter - SFDX With Charles Proxy. The primary difference is that I'm using Fiddler on Windows rather than Charles Proxy on macOS.

Using the direct sfdx logging support is another option to monitor what is going on. Or even browsing the source directly under %LOCALAPPDATA%\sfdx (seems they are going to some lengths to hide the source now). While something like fiddler is more complicated (some might even say "fiddly") to configure, it is harder to hide anything from it (intentionally or otherwise).

Configure to intercept HTTPS traffic

After installation the first this is to configure Fiddler and Windows to allow interception and decryption of HTTPS traffic.

  1. Tools > Options
  2. HTTPS tab
  3. Check Decrypt HTTPS traffic
  4. Click 'Yes' to reconfigure Windows' Trusted CA Certificate You might want to read up on what a Root Certificate is before doing so.
  5. (Optional) change the drop down from "... from all processes" to "... from non-browsers only"
  6. (Optional) Toggle the "Skip decryption for the following hosts" to "Perform decryption for the following hosts". Then add *.salesforce.com

Now the Fiddler is ready to intercept the traffic you need to configure sfdx to send it to the correct location. The default proxy port of 8888 is configured under Options > Connections > Fiddler listens on port:...

set http_proxy=http://localhost:8888
set https_proxy=https://localhost:8888

If you just stop there and try and call sfdx force:org:list you will find the CONNECTED STATUS comes back as "ECONNRESET". It would appear that node.js doesn't like our self signed root certificate. You can tell node to mind its own business with:

set NODE_TLS_REJECT_UNAUTHORIZED=0

Again, you only want to do this for a single session and not configure that across all processes. It potentially opens you up to all sorts of man in the middle security attacks.

Now what?

Now my friend, now we can see each and every callout to the Salesforce APIs and the corresponding responses.

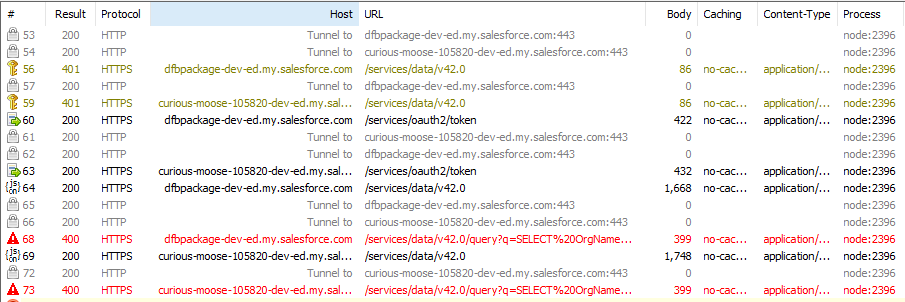
Lets look at what happens with the command sfdx force:org:list.

This reveals up to four API calls per valid Org. The exact calls will depend on the org types and if you have recently successfully authenticated to them. Generally, you get:

  1. A failed GET /services/data/v42.0 with an invalid token
  2. A POST /services/oauth2/token to refresh the access token
  3. A successful GET /services/data/v42.0
  4. A GET /services/data/v42.0/query?q=... with a SOQL query over ScratchOrgInfo. Presumably this only works with Scratch Orgs at this time.

So every org you register with SFDX needs 3 or 4 API calls with a force:org:list. There is certainly something to be said for dropping unused orgs.

Anyway... Happy Fiddling!

Wednesday, May 9, 2018

Salesforce Log Categories and Events by Level - Revisited

Way back in June 2014 I posted a table to logging events by level and category - Salesforce Log Categories and Events by Level.

I was never really happy with the table layout trying to squeeze that much data in. Also, new logging levels keep getting added and several have been shuffled around recently with respect to the level they occur at.

Here is a hopefully simpler revised attempt using lists. It is compiled directly from the Debug Log Levels detail page, so it should be eaiser to keep up to date.

Similar data can be found in the Debug Log Levels documentation. I found at the time of publishing that I had several in my list that didn't appear on that page, such as CALLOUT_REQUEST_PREPARE, USER_DEBUG_WARN, and DUPLICATE_DETECTION_MATCH_INVOCATION_DETAILS.

The levels are cumulative. So everything that appears at the ERROR level will appear at all the lower levels as well. Everything at the WARN level will appear at INFO, DEBUG, FINE, ... and so on.

Tuesday, April 10, 2018

The unofficial way to install Apps and Packages in Your Trailhead Playground

There is a Trailhead module called Trailhead Playground Management that includes a unit on Install[ing] Apps and Packages in Your Trailhead Playground. This is an important step in many other modules and day to day Salesforce work. You need to be able to install an App/Package into a target org so you can use its features.

The unit goes into the steps in some detail and focuses on being accessible to those just starting out with Salesforce.

Above is a quiz question from the Trailhead Playground Management module. It's technically correct as per the instructions in that module, but I don't think it is the best approach and from what I've seen is a common source of confusion.

I'd like to present an alternative approach. It might not be as accessible, but it does bypass a number of steps that can lead to further complications. So, without any more fanfare I present the Deployment Fish approved way of installing packages and apps into a Salesforce Org.

The URL Hack Manipulation Maneuver

The steps are as follows:

  1. Obtain the package installation URL.
  2. Copy everything from that URL except for the domain
  3. Log into the org where you want to install the package
  4. Paste the content copied from Step 2 after the domain.
  5. Follow the remaining prompts.

Let us try this as a worked example using the Install the DreamHouse app package from the Trailhead unit

  1. Obtain the package installation URL:
    Just right click on the package link and Copy Link Address. The approach will vary based on the browser, but there should be a fairly simple way to extract the link.
    https://login.salesforce.com/packaging/installPackage.apexp?p0=04tB00000009UeX
  2. Copy everything from that URL except for the domain:
    /packaging/installPackage.apexp?p0=04tB00000009UeX
    The ID with the 04t keyprefix is the important part here. That identifies what package/app you are installing.
  3. Log into the org/playground where you want to install the package
  4. Paste the content copied from Step 2 after the domain.
    URL before: https://curious-raccoon-286917-dev-ed.lightning.force.com/one/one.app#/home
    URL after: https://curious-raccoon-286917-dev-ed.lightning.force.com/packaging/installPackage.apexp?p0=04tB00000009UeX
  5. Follow the remaining prompts.

AppExchange packages

A similar technique can be used with the AppExchange. The only catch here is they make it a bit harder to get the package version id. Lets use the Salesforce Adoption Dashboards as an example app.

  1. From the app listing, press "Get It Now".
  2. You may need to login to the AppExchange. It doesn't matter what account you log in with at this step.
  3. On the "Where do you want to install this package?" select either the "Install in Production" or "Install in Sandbox" buttons. It shouldn't matter.
  4. Move past the Confirm Installation Details page and press "Confirm and Install"
  5. You will end up at a login page. DO NOT LOGIN HERE!
    Look closely at the URL. You will see the package version ID.
    In my case it was https://login.salesforce.com/?startURL=%2Fpackaging%2FinstallPackage.apexp%3Fp0%3D04t410000009jsfAAA%26newUI%3D1%26src%3Du
  6. Append that ID to /packaging/installPackage.apexp?p0= on your actual target org as you did in step 4 of the URL Manipulation Maneuver.
    /packaging/installPackage.apexp?p0=04t410000009jsfAAA

These steps may look complicated at first, but in reality it is a small cut-and-paste job to find the package version Id. Once you have the Id the rest of the process becomes much simpler. You could even look at automating the process using the SalesforceDX CLI.

The real benefit is for those that routinely work between multiple orgs. It provides more certainty that you are installing in the org you intended to. Plus you don't even need to figure out your Trailhead playgrounds authentication details.

Sunday, April 1, 2018

Breeding your own deployment fish

Sometimes it just isn't practical to head out into the ocean to catch your own deployment fish. Or the metadata gods don't favor your change set with a fresh catch.

What are you to do if the deployment fish aren't biting?

JavaScript to the rescue!

A few moments of playing on the /changemgmt/monitorDeploymentsDetails.apexp page reveals that JSON data about the current deployment status flows through SfdcApp.MonitorDeployment.InProgressComponent.refreshInProgressSection. We can call the same function ourselves and manipulate the totalComponentsCount and succeededComponentsCount data as required:

SfdcApp.MonitorDeployment.InProgressComponent.refreshInProgressSection(Sfdc.JSON.parse('{"hasErrors":false,"hasFatalError":false,"refreshInternalInMillis":3000,"hasCodeCoverageError":false,"totalTestsCount":20,"totalComponentsCount":4,"succeededComponentsCount":21,"isComponentSaveFailing":false,"isDeployComplete":true,"failedComponentsCount":0,"failedTestsCount":0,"isDeployCanceled":false,"completedDate":"4/1/2018 1:33 AM","hasTestRunStarted":false,"isCheckOnly":true,"isTestRunFailing":false,"isAbortRequested":false,"hasPayloadError":false,"isTestRunRequired":false,"stateDetail":"","succeededTestsCount":20,"deployStatus":"Succeeded"}'), !0);

Better yet, we can wrap it in our own function to call as required.

function deploymentFish(a, b) {
  var c = Sfdc.JSON.parse(document.getElementById(chartDataHiddenElementId).value);
  c.succeededComponentsCount = a;
  c.totalComponentsCount = b;
  document.getElementById(chartDataHiddenElementId).value = Sfdc.JSON.stringify(c);
  SfdcApp.MonitorDeployment.InProgressComponent.refreshInProgressSectionBasedOnServerData();
}

Or, if you prefer, in bookmarklet form: (Installation link for Deployment Fish)

javascript:(function(){
var d = prompt('Deployment fish size?', '17/14');
var a = parseInt(d.split('/')[0]);
var b = parseInt(d.split('/')[1]);
var c = Sfdc.JSON.parse(document.getElementById(chartDataHiddenElementId).value);
c.succeededComponentsCount = a;
c.totalComponentsCount = b;
document.getElementById(chartDataHiddenElementId).value = Sfdc.JSON.stringify(c);
SfdcApp.MonitorDeployment.InProgressComponent.refreshInProgressSectionBasedOnServerData();
})();

Monday, March 12, 2018

The Trailhead Electric Imp project

For some time now I've been meaning to complete the Electric Imp Trailhead project. Unfortunately there were a couple of things holding me back from completing it.

Firstly, I needed the physical impExplorer Developer Kit hardware.

The board itself is a pretty reasonable $25 USD. And then I got to the shipping options to New Zealand in the cart and it looked something like this: (circa 2017)

Ouch! A bit hard to justify $116.49 shipping on a $25 purchase. To be fair, I checked it again today while writing this post and they now have some much more reasonable options via USPS starting at $16.33 USD.

Anyway, as luck would have it I found some time to sit down in the Dreamforce '17 Developer Forest and start working through the project on site with the provided hardware. For some reason that I can't recall I opted to work through this module with an existing Developer edition org (lack of time to delete and then create a new trail org?). It was also my downfall, as the org had a namespace defined and the IoT Contexts didn't seem to support namespaces. There were GACKs all over the place. Lesson learned, next time I'll be tackling it against a clean org.

Fast forward to today, some months after Dreamforce and I've got some spare time to sit down and tackle this again. An no, I haven't forgotten the second thing that was holding me back. I'm just getting to that now.

I needed a fridge to use for the project. One that also got a good WiFi connection. I don't know about you, but my actual fridge is a bit of a WiFi dead zone. It's probably either the proximity of the microwave or the Faraday cage I wrapped it in to protect my ripe avocados from EMP attacks. This was an easy enough problem to solve. Like anyone else with a 3D printer, the solution was only several hours of plastic extrusion away. It turns out there was a purpose made fridge ready to go on Thingiverse- Model Fridge for Salesforce IoT Electric Imp Developer Board.

With my new mini fridge, electric imp board, and three AA-batteries-I-borrowed-from-my-sons-remote-control-car-but-will-replace-before-he-wakes-up I embarked on completing the project.

There appears to be two general ways to approach this trailhead project. You can either follow the instructions carefully and double check everything as you go (my chosen path), or you can just jump through pressing as fast as you can because each step ends with the statement:

We won’t check any of your setup. Click Verify Step to go to the next step in the project.

Boo! This is actually a real pain, as there isn't anything to indicate if you've taken a misstep at any point along the way.

That said, it is all fairly straight forward if you are proficient at following instructions plus cutting and pasting.

The IoT orchestrations were new to me and hence the most challenging part of the project. For instance, I initially found it confusing that the conditions you define on a State are the exit criteria that transition to the other states. I guess this makes sense as a finite-state machine would only be concerned with the transitions it can make from the current state. E.g. If I'm in a door open state, I'm only interested in transitioning back to the default state when the door is closed again.

As the Electric Imp is communicating to Salesforce via Platform Events it provided an easy mechanism to send in mock readings via Apex. This helped with testing when your child wanted the AA batteries back.

Smart_Fridge_Reading__e mockReading = new Smart_Fridge_Reading__e();
mockReading.deviceId__c = '23733t1ed87bf1ee';
mockReading.door__c = 'Closed';
mockReading.humidity__c = 10.441;
mockReading.temperature__c = 8.6859;
mockReading.ts__c=DateTime.now();
EventBus.publish(mockReading);

Things I'd change? I'd probably take the light sensor LUX reading and relay that directly back to Salesforce rather than having a configured level to indicate that the door is open. I'm assuming it has the current form to show how values can be passed back from the Device to the Agent for additional processing. I'm also interested in the accelerator and air pressure sensor which are part of the imp001 hardware but aren't utilized in this badge. Maybe another state if the fridge door is closed too hard?


If you go away from the project for several days you might get the following error message from the Agent code:

[Agent] ERROR: [ { "message": "Session expired or invalid", "errorCode": "INVALID_SESSION_ID" } ]

In my case that was caused by the agent code persisting the access_token that it gets via the initial OAuth process. There isn't an automated mechanism to drop the expired session details or refresh it. Instead you need to use the Agent URL to complete the OAuth process again.

See Expired OAuth details being restored by getStoredCredentials()


Other related Trailhead modules:

Friday, November 17, 2017

Dreamforce 2017 Round-up / Summary

My carefully curated session agenda. It didn't last long.

In what is becoming a tradition for me I went into Dreamforce 2017 with a wildly optimistic 72 breakouts, theater sessions, and keynotes bookmarked that I wanted to attend. Like Codey desperately holding onto the clock on the Agenda page, I knew that was never going to work.

Instead I had a few key sessions and keynotes that I knew I wanted to attend. Beyond that, I just tried to go with the flow of the conference and to focus on doing things that I knew I could only do there in person.

It was certainly several whirlwind days that I'm only just now starting to piece back together from a trail of photos on my phone and tweets. Even seeing some of it coalescing in a single blog post is somewhat daunting assemblage.

Table of Contents

  1. Preconference
  2. Self Driving Astro in the IoT Grove
  3. Day One
    • Mini Hacks
    • Main Keynote
  4. Day Two
    • Mass Actions, Composite, and Bulk APIs
    • Salesforce Platform Limits
    • Developer Keynote
    • Meet the Apex Developers
    • Dreamfest
  5. Day Three
    • Advanced Logging Patterns With Platform Events
    • Build Custom Setup Apps & Config Tools With the All-New Apex Metadata API
    • The Future of Salesforce DX
    • True to the Core
    • Meet the Developers
  6. Day Four
    • Lightning Round Table
    • Salesforce Tower
  7. Walking Peanut butter distributor
  8. Random Photos

Preconference

According to my phone the first on the ground Dreamforce thing I did after picking up my badge was head into Moscone West. Pretty much business as usually, except it was the Sunday before the conference opened.

I was there to setup my Self Driving Astro. More on that below.

It was an interesting glimpse into what goes into setting up such a massive conference. There were a lot of people working hard and putting in some big hours to get everything setup and going in time of the opening the following morning.

On Sunday afternoon I also participated in the MVP volunteering event

Self Driving Astro in the IoT Grove

Way back in April this year after giving my automated Einstein powered cat sprinkler talk to the Sydney Developer User Group I'd latched onto the idea to use the Einstein Vision Services to make a rudimentary self driving car. It was an itch that needed to be scratched. So I started working on it on and off since then and submitted it as a possible talk for Dreamforce.

Sadly it didn't get accepted as a talk this year. I suspect it was a little too far off the actual promoted use cases for the Einstein services. So while it was fun in concept, it could have lead to some confusion with customers about what the Salesforce offerings would be used for. Contrast it to something like the Identify Protein Structures Using Einstein talk, which sounds interesting in its own right and is on my list of sessions to catch up on.

It did leave me with a partially finished project that I'd put in all that effort and resources into. So rather than just mothball it I decided to carry on and make it a blog post instead. I'm glad I did, as it has been an excellent excuse to dive deep into the Metamind APIs and contribute to some GitHub projects along the way. It also formed part of an extended Einstien vision talk that I gave to the Auckland Developer User Group.

I published the blog post about it on the 20th of October. That was just over two weeks out from Dreamforce to avoid it getting lost in the noise of the conference. Then the next day Reid Carlberg asked if I was bringing it Dreamforce and if it could be setup on display. I jumped at the opportunity and set about reworking it from something that had only ever been run for 10 to 15 minutes at a time to something that would have to run continuously for 9+ hours a day. I had 11 days before I needed to be on my flight for Dreamforce.

Needless to say, it was a busy run up to departing for Dreamforce to:

  • Print a new slightly larger seat,
  • Design and print a new steering column,
  • Upgrade to a larger metal gear servo,
  • Print a new steering wheel for the new servo,
  • Print a modified case for the Raspberry Pi to support the HAT and relay,
  • Design and print a case for the Larson Scanner board to prevent shorts,
  • Reinforce all the wiring to survive travel in checked luggage.

Somehow it all came together in time along with a number of software updates to minimize the API counts and make the error handling more resilient. Many thanks to:

  • Reid Carlberg for the opportunity to set it up in the IoT Grove.
  • Michael Machado for giving me a temporary bump on the Metamind API limits.
  • Josh Birk for helping to get it setup and running. Plus keeping an eye on it during the conference along with @codefriar and others in the IoT Grove.

Day One

The first day went past in a bit of a blur. I was in and about the Mini hacks area volunteering during the morning and then over to the main keynote in the afternoon. In between I did a bit of exploring around Moscone West.

There were a number of areas touched on in the main keynote. In particular:

  • the customization of myLightning to change the color themes and visual designs of the UX.
  • mySalesforce for creating mobile apps in Lightning.
  • myTrailhead for Trailhead customized to other companies.

Also confetti - lots and lots of confetti.

Day Two

The day started off with finding confetti from the keynote just about everywhere in my bag.

Mass Actions, Composite, and Bulk APIs

I managed to catch my first full session today by @thunderberry and @abhinavchadda. While both the Bulk API v2 improvements and Open API support sound really useful, what intrigued me most was the proposed Mass Actions API. This could radically speed up a number of operations by defining a transform over a query. The exact details on how it will be split into transactions and how limits will be addressed is something to keep an eye on with this.

Salesforce Platform Limits

This session was again with @thunderberry. The proposal here is to move a number of existing limits to become "soft limits". Then depending on the pod heath you would be able to burst past the standard limit for short periods. There would still be an upper maximum burst limit. Consistently running past the soft limit will get you on a naughty list where Salesforce will encourage you to either upgrade or pin you to the existing limits. If the pod is particularly busy you would be more limited in what you could burst to.

This all sounds good in theory, but it will make debugging more difficult. Something that works within the soft limits one moment could fail the next due to the org load. This does seem a bit like the current Apex CPU limit.

A quick tip from this session:

Don't poll the existing limits API to frequently. The calls to that still count against your API call count limit.

Developer Keynote

The first thing that struck me about the Developer Keynote is what a fashionable bunch the developers are.

A "Suspicious Looking Plant" and some Aloe vera.

If time permits I'll come back to this section to recap some of the content.

Meet the Apex Developers

I asked a question in this session about ENTERING_MANAGED_PKG appearing in debug logs and how it can frequently consume 80% plus of a 2MB log in a dev packaging org. They had been forewarned that this question was coming and thankfully the response was they are onto it and will be fixing the excess logging in the future. 🎉

Dreamfest

AT&T park made an excellent venue in terms of proximity to most of the hotels, visibility of the stage, and facilities for dealing with that many attendees.

Day Three

Advanced Logging Patterns With Platform Events

Using Platform Events to push logging events out and then monitoring them using a Utility Bar app.

Build Custom Setup Apps & Config Tools With the All-New Apex Metadata API

The Future of Salesforce DX

This session is well worth a repeat watch. Very dense on upcoming changes with DX. Mostly forward looking, but still interesting.

Change Data Capture: Data Synchronization in the Cloud

True to the Core

Meet the Developers

Steve Tamm rallying the troops prior to the Meet the Developers session

I asked a question in this session about raising support cases for GACKs and those without Premier support being turned away to the developer forums. If you have specific examples of this happening that you want to share please see Examples of being bounced by Salesforce Support to forums when encountering a GACK

Day Four

Today was a bit interrupted from attending sessions, but in a good way!

Salesforce Tower - Ending Dreamforce on a high

Walking Peanut butter distributor

This year I brought 3kg/6.6lb of Pic's peanut butter with me to give out to people. It's made right here in Nelson, New Zealand and I figured I'd be the only person giving out peanut butter at Dreamforce. At the very least it made for an interesting conversation starter. Not too many people thought I was the nutty one in the transaction (at least out loud).
And to those with peanut allergies - no hard feelings, can we still be friends? I wasn't really trying to kill you.

Sessions I mean to catch up on

Random Photos